The Pitch · 90 Seconds
The whole idea, in ninety seconds.
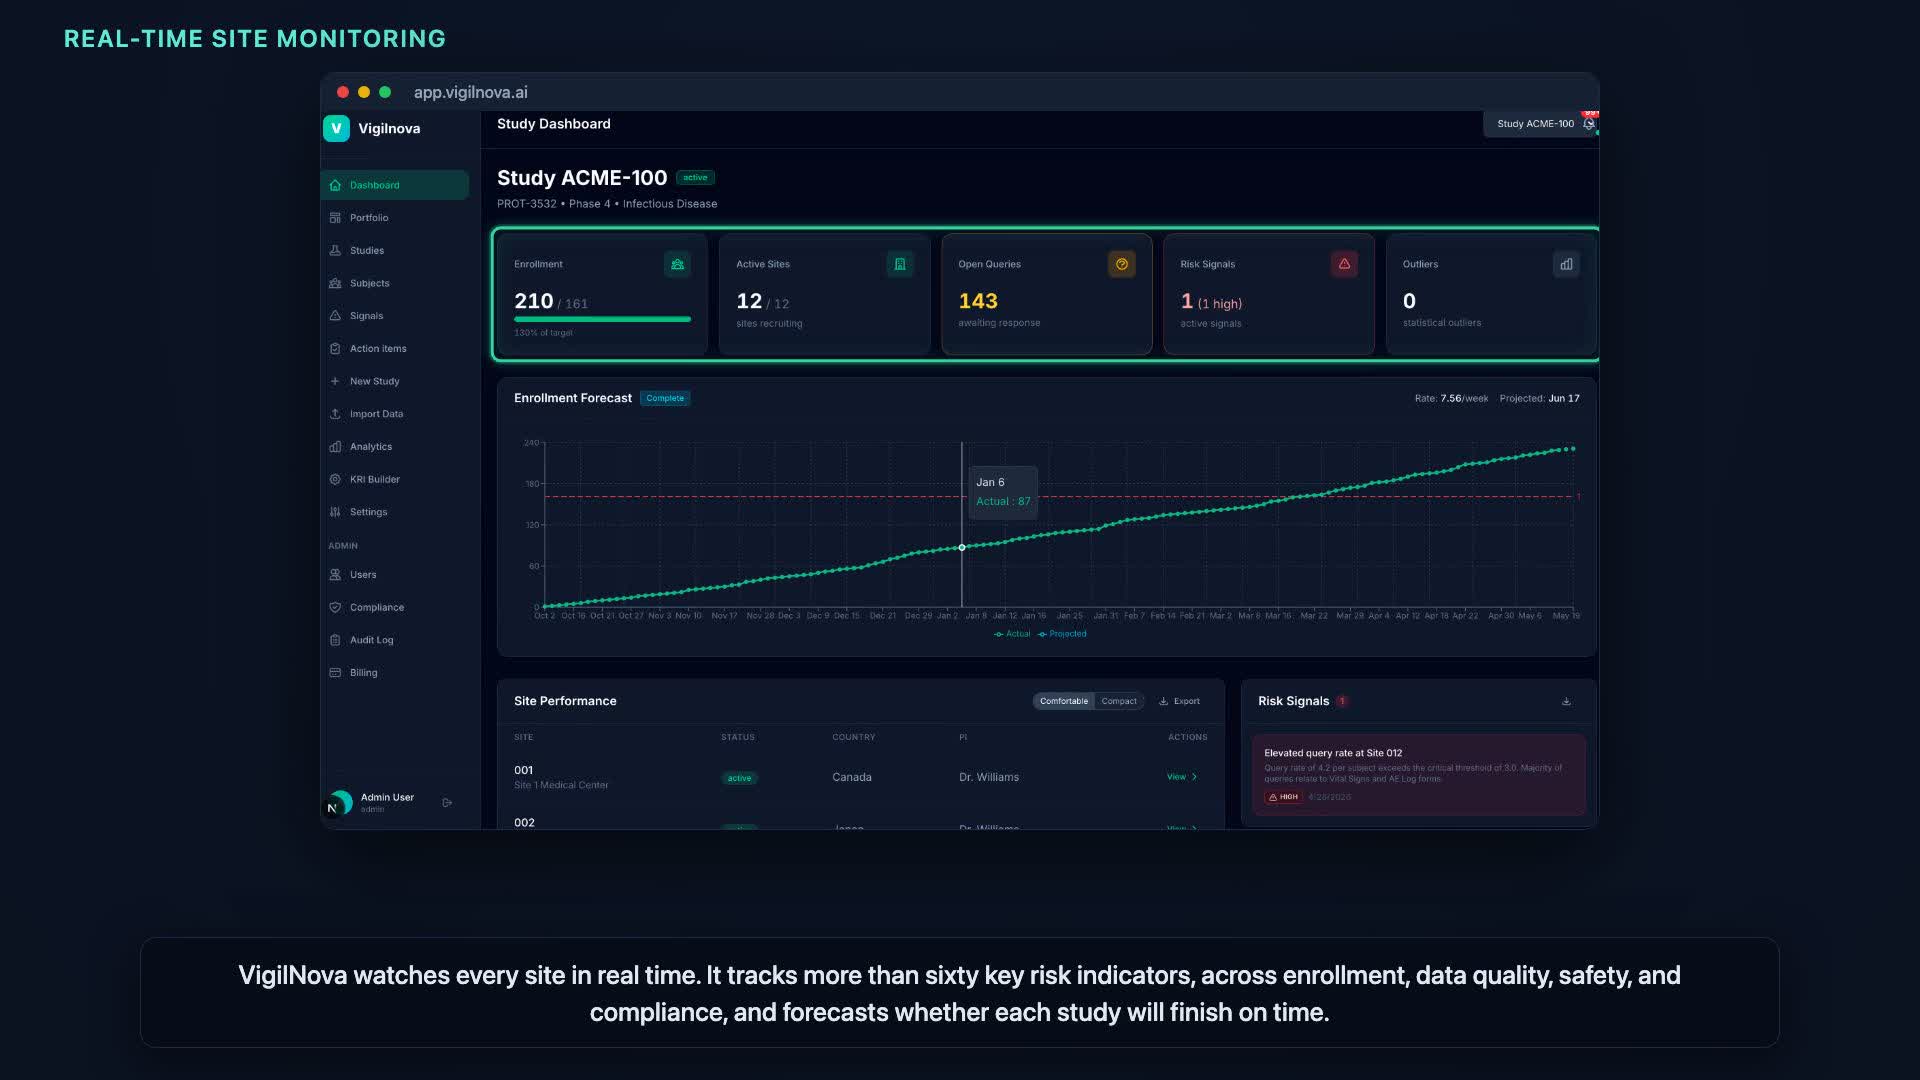
VigilNova is risk-based monitoring made continuous: every site watched in real time, risks surfaced before they turn critical, and a clean trail of who reviewed what.
 ▶ Pitch · 1:18